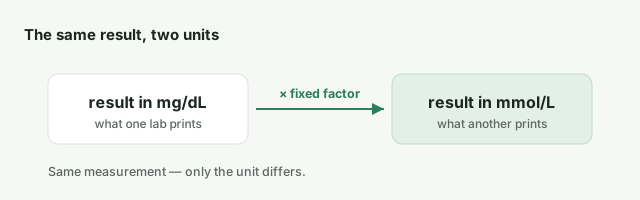
A cholesterol result of 5.2 and a cholesterol result of 200 can describe the same blood. They are the same quantity in two different units, and the gap between the numbers is large enough that comparing them by eye goes badly.
Two ways of counting the same thing
Mass concentration asks how much the substance weighs in a volume of blood — milligrams per
decilitre, mg/dL. Molar concentration asks how many molecules are in it — millimoles per litre,
mmol/L.
Neither is more correct. They answer different questions about the same sample, which is why the conversion between them is not one factor for everything: it depends on the molecular weight of whatever is being measured. Glucose and cholesterol do not convert with the same number.
MedlinePlus lists several of the units a report may use, including "Mcg/dL = micrograms per deciliter", "Micromole/L = micromoles per liter" and "Pg/mL = picograms per milliliter" — the same substance can appear in more than one of these depending on who ran the test.
How to tell which you are holding
Read the unit column, not the number. It is the only reliable signal. As a rough orientation,
mass-concentration units end in /dL or /mL, molar units contain mol.
Country is a weaker hint than it looks. Reports from the same city can differ, and a laboratory
may switch. Some Indian reports print lipids in mg/dL and glucose in mg/dL while an HbA1c
appears as a percentage and a separate row gives an estimated average glucose in mg/dL — three
conventions on one page.
Why this breaks comparisons quietly
If you are tracking a marker across labs or across countries, a change of unit looks exactly like
a change in your health: the number moves sharply and nothing on the row says why. The reference
interval moves with it, which is the tell — an interval that used to read <200 and now reads
<5.2 did not become stricter.
This is a specific case of the general rule MedlinePlus states: check the reference range printed on your own report, and do not compare your results to ranges "you might find elsewhere".
What Arkalife does with this
Values are stored exactly as the laboratory printed them — the original number, the original unit — and a canonical value is derived alongside for charting, so a history assembled from labs using different conventions plots on one axis without overwriting what any report actually said. When a unit cannot be resolved confidently, the reading is stored and displayed but left off the chart rather than converted with a guess.